
Affinity Diagram Template
The affinity diagram, which is also known as the KJ method, is a commonly used technique for brainstorming sessions in […]
The affinity diagram, which is also known as the KJ method, is a commonly used technique for brainstorming sessions in […]

SWOT stands for Strengths, weaknesses, opportunities, and threats and it is a perfect business planning model for each kind of
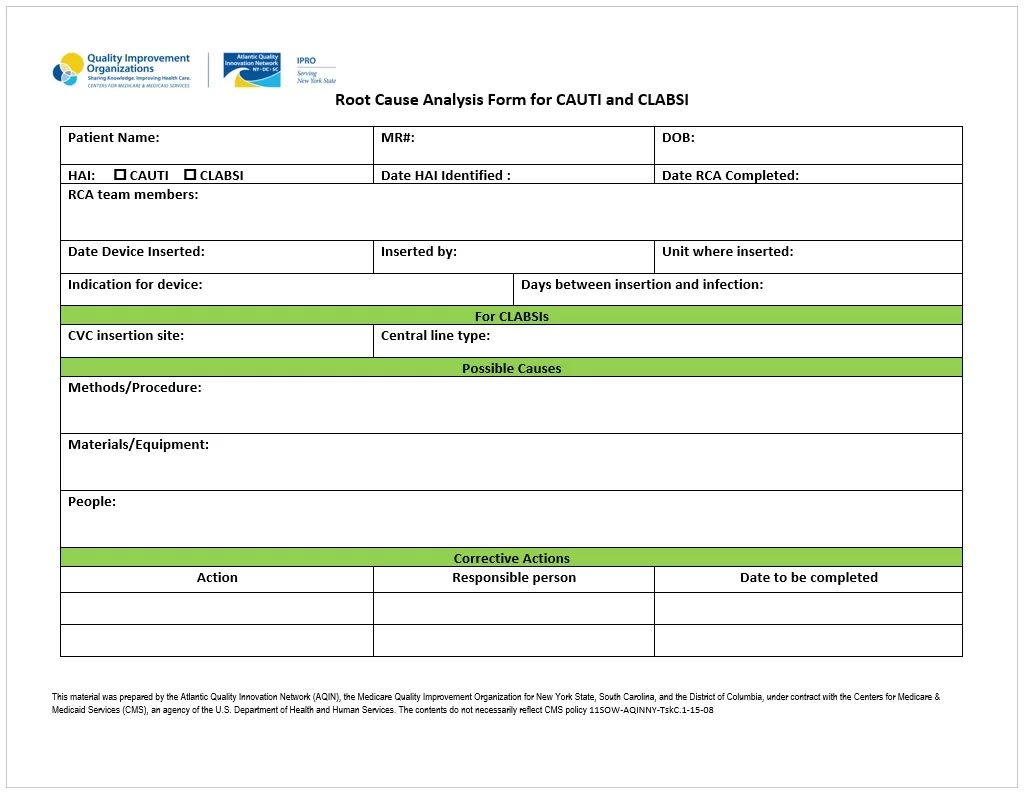
A root cause analysis diagram which is also known as a fishbone diagram, Ishikawa diagram, or cause and effect diagram
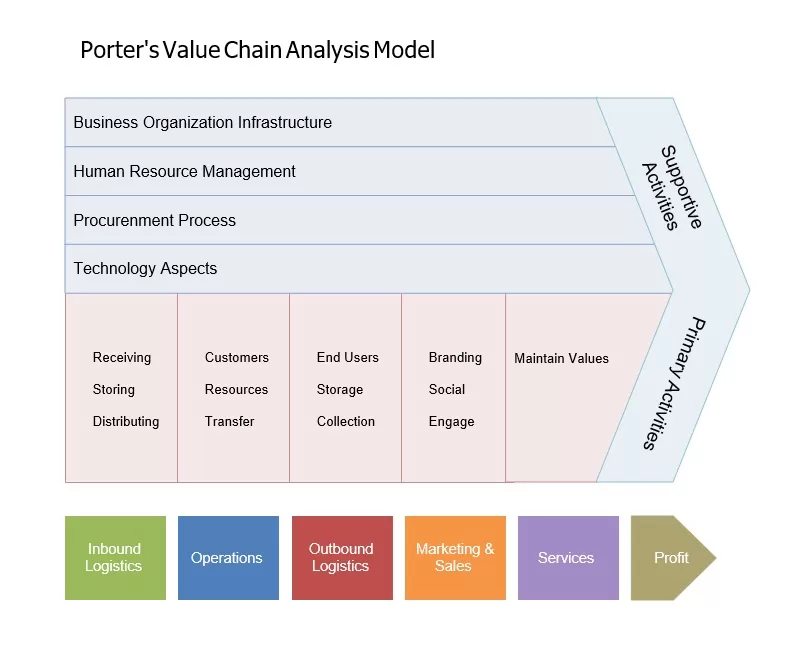
A value chain analysis diagram is a corporate tool or technique that ensures that you have an eye on all
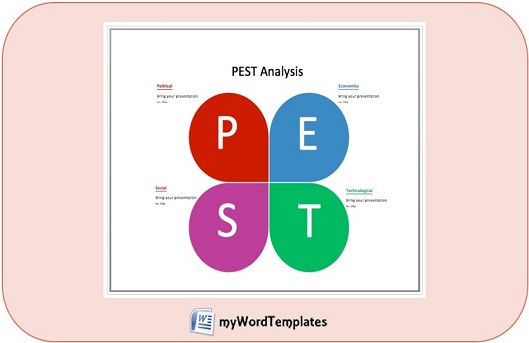
PEST is a word with for alphabets and in this word; each alphabet stands for a unique and important market
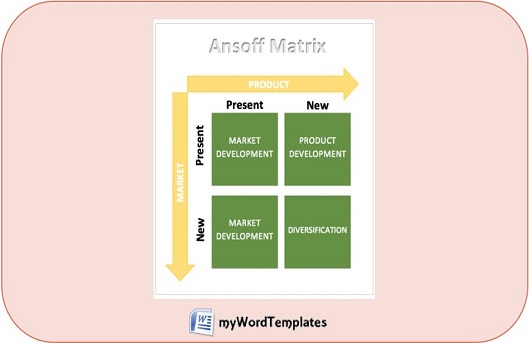
Asnoff Matrix is something that helps people and businesses in a better way at the same time. As a business
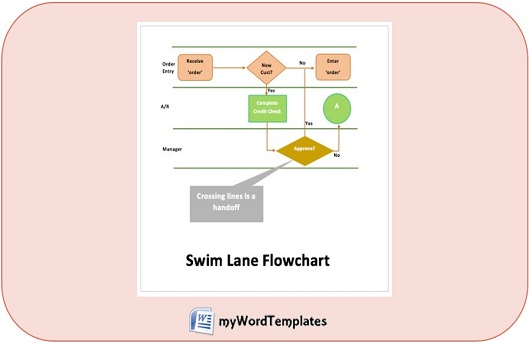
A swim lane flow chart which is also known as a swim lane diagram or cross-functional diagram is a commonly
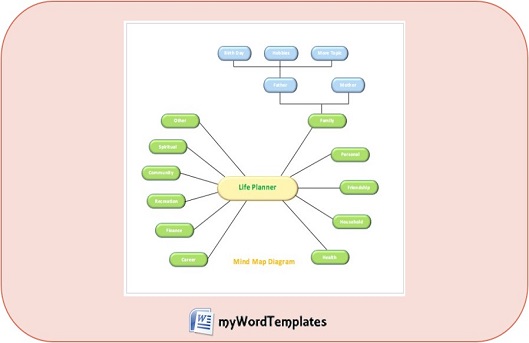
Mind mapping is a common and simple technique that is used regularly in businesses and corporations. This is a technique
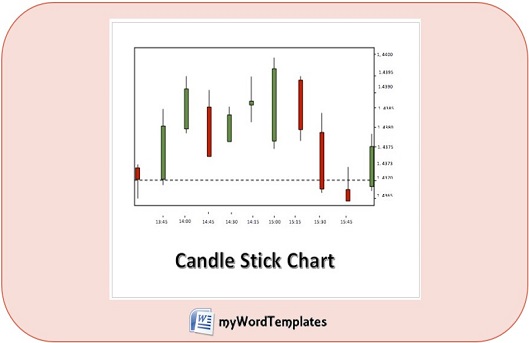
Most people find it hard to understand the candlestick chart concept when in reality; it is not that hard to
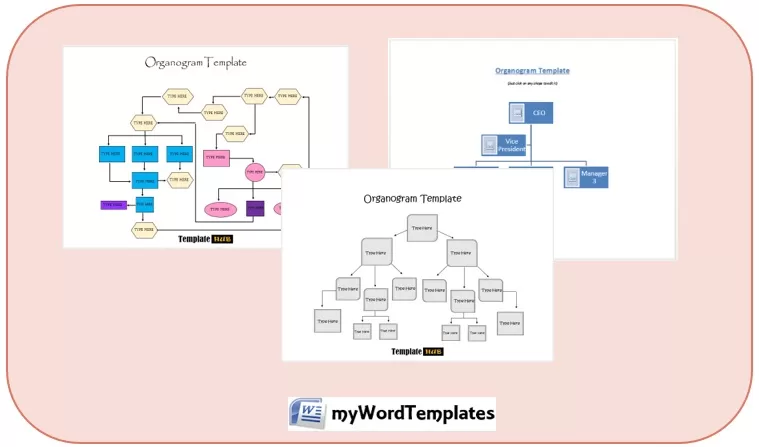
Organizational structure is an important part of any organization because it helps you to understand who reports to whom. Functional

WBS or Work Breakdown Structure is a business or corporation technique used in companies and organizations to execute projects. This
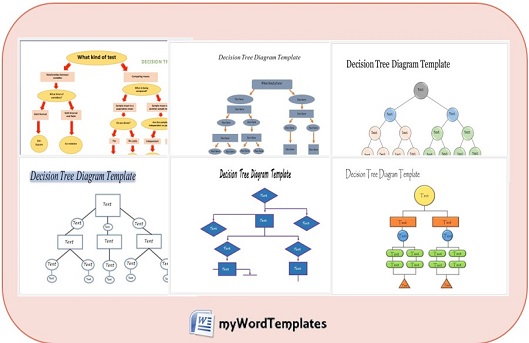
Allow me to share with you these 7 Free Decision Tree Templates in MS Word Format to help you in
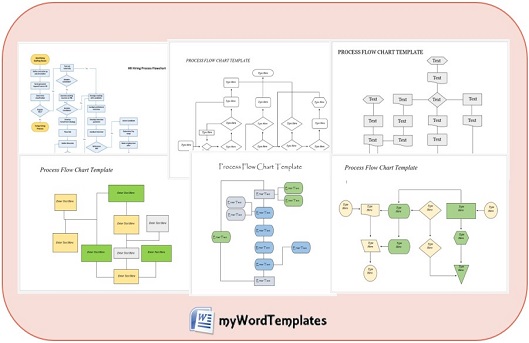
Let me share with you my own created 7 Free Process Flow Chart Templates in MS Word to assist you

Genogram Template can be used to create a good-looking Genogram very quickly. A Genogram may be a household map or
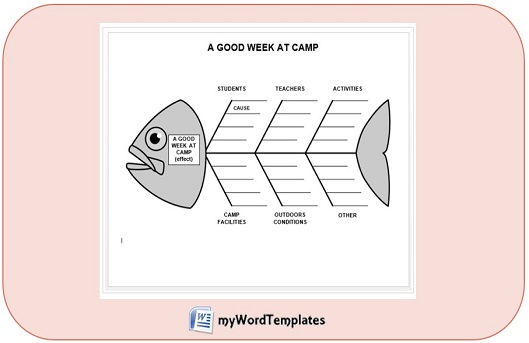
Allow me to share with you this Fishbone Template in MS Word Format to help you prepare your own Fishbone Diagram

A Venn diagram is a graphical presentation or illustration of different objects overlapping each other. Most commonly, professionals use this

UML stands for Unified Modeling Language and sequence diagram is a very common and important technique for representing data and
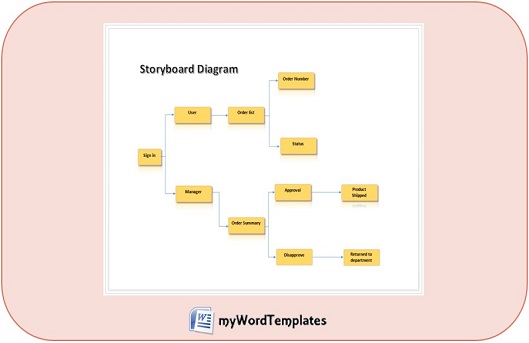
A storyboard is kind of a presentation or technique of illustrating the process of a project or new product development
When it comes to project management, time, quality, and cost are the only three elements that companies and organizations concentrate

Risk management for companies and businesses is as important as breathing for living beings. A company can’t run or make
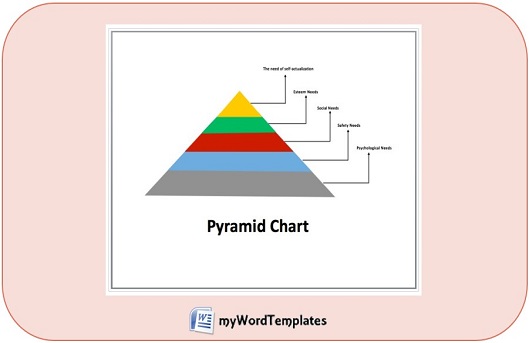
A Pyramid Chart is a graphical representation of the facts, figures, and research material in the form of a pyramid