
Network Diagram Template
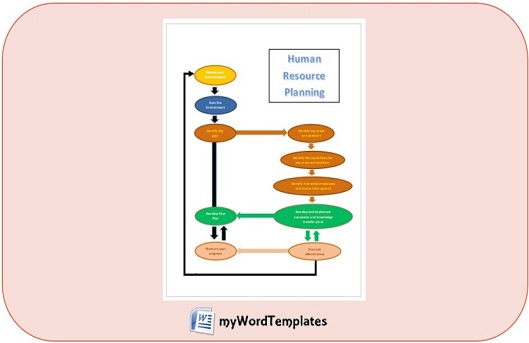
A network diagram is also known as a project network diagram or flow chart in simple words and this is […]
A network diagram is also known as a project network diagram or flow chart in simple words and this is […]

A relations diagram which is also known as ER diagram or entity relationship diagram is a commonly used technique in

PERT which stands for Program Evaluation Review Technique is a business or organizational tool that is used for managing the
Some people find it quite difficult to understand the gap analysis when in reality, it is not that hard. If

When it comes to project management, the process is tougher and complex as compared to the other areas and fields

A Pareto chart is a special kind of graphical presentation. We can also call it a hybrid graph in which

The cause and effect chart which is also known as the fishbone diagram or the Ikishawa diagram is a commonly
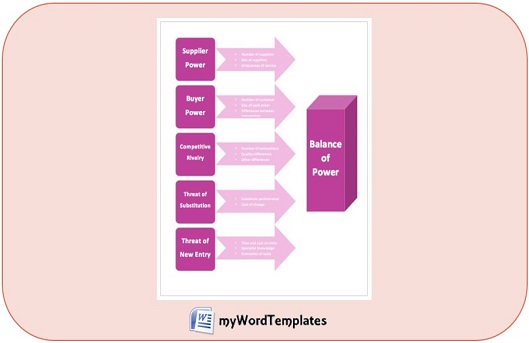
Porter’s five force diagram is a simple but very important tool for analyzing the market for new and existing companies.